Description
This tool provides some static code analysis. It is able to parse some preprocessed C source code and generate different graphs from the caputred data.
The parser is written in C++, using flex++ and bison++ as scanner- and parser-generators.
The lastest version does only support standard C99 source code as well as C source for Tasking 6.0r4 compilers (almost completely). GCC is not supported right now, due to proprietary language extensions (gcc has many intrinsic functions).
The tool is tested under Linux (RH9) and Cygwin (1.5.7).
Unpack the source:
and read the files README and INSTALL for a description of the build and installation process.
Usage
After you unpacked, build and installed the tool successfully, type
for a complete list of parameters. For a more concrete example, please read the tutorial.
Tutorial
This tutorial shows how to use the tool and what kind of outputs you can get. As mentioned above, there is only a very limited support for compilers, therefore this tutorial only uses Standard C99.
To go through the tutorial you will need the built and installed tool and a working GraphViz installation (at least dot).
The Source
We have 2 modules:
which have some internal data and functions as well as some exported function. module_a even has global data.
Preprocess the Code
Although GCC is not supported, we use it to preprocess the files. This works because the source code for this tutorial does not contain any proprietary extensions.
This creates two new files:
module_a.Emodule_b.E
Parse the Source
Now let’s parse the preprocessed code:
Short explanation of the parameters:
| Option | Descritption |
|---|---|
-p std |
The parser shall use the Standard C99 parser. |
-r analysis |
Use the report generator analysis |
-o source.dat |
The output of the report generator shall be stored in this file. We’ll need this file to generate the graphs. |
*.E |
Those are the input files: all preprocessed source files. |
Generate Output
Since we have all necessary data, we’re able to generate some graphs. There are more possible output types, but now we will do the most common.
Call Graph of a Function
Inverse Call Graph of a Function
Dependencies of a Module
Details of a Module
Access to a global Variable
Generate the Graphs
Clean Up
Results
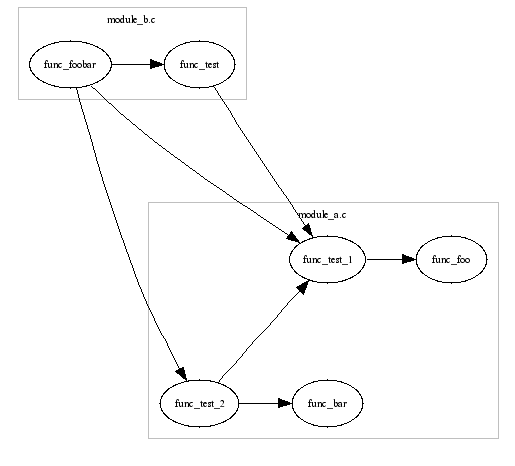
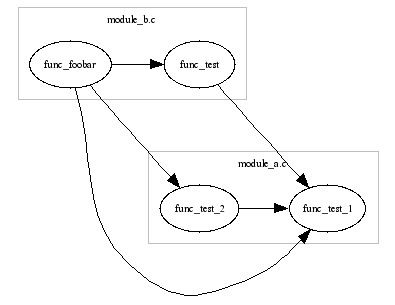
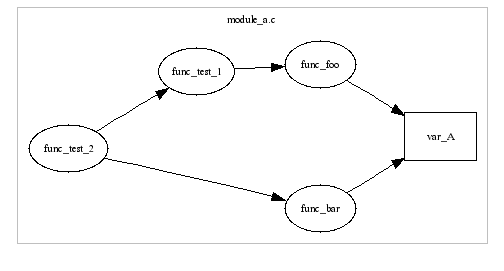
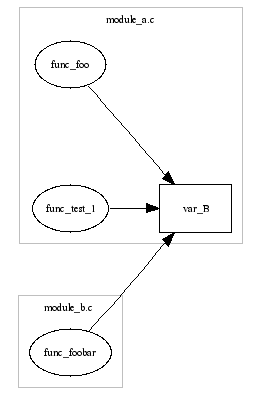
Finally, after the hard work ;-) we may enjoy the results.


Download
All source code provided by this page is distributed under the terms of the GPL. Read also the LICENCE file. Use it on your own risk.
Versions: